|
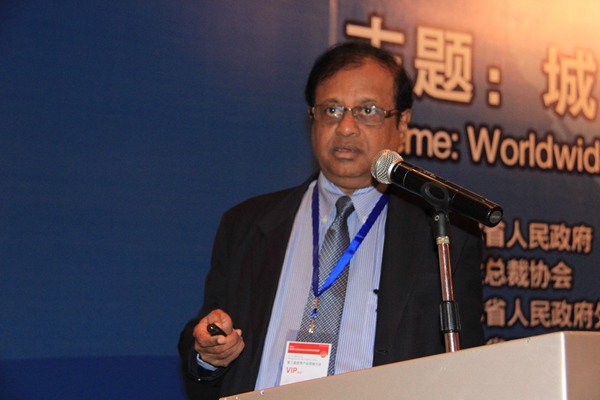
outline of the speech (for more speech info,please feel free to contact us):
Renewable Energy and Waste Disposal Investments and Challenges to Ecological Civilization and Environment, Arising from Urbanization
Susil Premajayantha
Minister of Environment & Renewable Energy, Sri Lanka
Content of the Presentation
Critical Environmental Problems and Issues in Sri Lanka
Renewable Energy Sector Development
Current Process Gaps & Issues of the Solid Waste Management
Challenges of urbanization
Environmental Priorities and Targets by 2016
Critical Environmental Problems and Issues in Sri Lanka
Deforestation and encroachment of agriculture on forests;
Coastal erosion, and resulting damage to beaches, coastal conservations and communities.
Soil erosion and loss of agricultural productivity of the land;
Pollution of water bodies, coastal eco systems and beaches caused by the discharge of industrial pollutants and raw sewage;
Sea level rise, landslides floods and other natural disasters
Situation of reservoirs built for irrigation and /or hydro power generation purposes;
Poor natural resource management and land use patterns, resulting in the marginalization of lands, loss of productivity and depletion of non ĘCrenewable resources;
Atmospheric pollution from vehicle emissions and industries;
Urban expansion without concomitant infrastructural growth, resulting in the proliferation of slums and shanties, and many other urban problems.
Annual population growth of 0.79%.
GDP growth of 6% - 7% per year electrification rate stood at 92% by the end of 2011 94% as reported by CEB
All corners of the country served with petroleum and electricity
Country is blessed with 24x7 power supply
Energy demand showing all signs of increasing demand at 8% -10% annually
The total installed capacity of electricity generation in Sri Lanka will be more than 3,550 MW (by end 2012)
Share of major hydro's in the power generation mix dramatically declined from 99.7% in 1986 to 46.3% in 2010 as demand growth has been met primarily by oil fired thermal generation.
The country falls into the category of low energy intensity countries, averaging only 0.43 toe per capita and commercial energy intensity of 0.18 toe per capita per annum.
Power Sector Outlook
Coal based capacity (commissioned in March 2011) has 10% share and energy share in 2011 was 9%- If all goes well, 15-20% energy can be from coal by 2016
Capacity and energy mix presently dominated by oil based capacity (~44% share) and generation (50% share)
Hydro, the second largest with share of ~38% in capacity and ~35% in generation mix and future fuel mix increasingly dominated by coal
Sri Lankan GDP was at USD 60 billion with a corresponding per capita income of USD 2,836
The energy elasticity of GDP varies considerably from year to year due to increasing reliance of low energy intense service sector for GDP Growth
The energy demand will grow rapidly with the Governments goal to keep GDP growth above 8% per year.
What Sri Lanka has Achieved in Renewable Energy (RE) Resources
Concerns
The power sector is fast approaching a future dominated by coal power
Few large power plants scattered around the country
Stationary sources, easier for monitoring and control of emissions
Fuel quality issues yet to surface
We still have the opportunity to manage these emissions
Identify where demand is growing at an increased pace
Transport sector must be our foremost concern
Current Process Gaps & Issues of the Solid Waste Management
Organic fraction exceed 60 %
Windrow composting plants implemented by Local Authorities
100% of plants carry out site separation
Residue
Open burning
Semi controlled Land Fills
Open Dumping
SW Generation & Composition
0.85 kg in Colombo Municipal Council
0.75 kg in other Municipal Councils
0.6 kg in Urban Councils
0.45 kg in Pradeshiya Sabhas
Estimated total generation 6400 kg/day
Collection ĘC 2700 kg per day
Gaps and Issues in Our Municipal Waste
Organic fraction exceed 60% only in public fairs, most town areas percentage of non organic materials are very high.
No permanent remedial measure work to treat these non organic matter else where.
Source separation implementation and the people mobilization to the process is a severe issue.
Most composting sites are adhoc as are the non recyclable materials and residue dumping
High content of sand exceed 10% (Puttalam Uc, Kalpitiya P.s)
Pathogen inactivation is less due to inadequate temperature
Weeds growing in compost due to inadequate temperature
Difficult to get the quality report in each batch
Identified Gaps
Conceptual gaps
- Policy gaps ( National & Provincial Level)
- Enacting & implementing existing by Laws
- Difference of the composition between forecast and Existing situation
- No suitable land for the final disposal
- Creation of waste free culture
Quality gaps
- Standard Quality and Existing Quality
- Quality of Composting
- Poor practice of source separation
- Poor practice of segregation (Recyclable)
Delivery Gaps
- Production concentrated to one area specially within the site.
- Compost Promotion by LA is very limited
Satisfaction Gaps - Except some sites, people are not satisfied with the existing process
Densely Populated Cities
20 million people with diverse population
35th most densely populated nation in the world
Appropriate housing solutions for low & high income groups- high-rise low-density housing
Improve public and alternative modes of transportation
Change the way cities develop-shift from resource-driven to technology and innovation.
Ensure equitable access to and efficient use of energy
Structural adjustment to achieve a low carbon economy
Attain green growth and harmonious development
Provide urban plans that accommodate lifestyle and business opportunities
Meeting these challenges will require innovation in policies and institutions Industry
Tourism, tea export, apparel, textile, rice production and other agricultural products
Issues that Transcend our Borders
Environmental Issues
Shifting from agricultural-based economy to service & industry based economy
Rural to Urban influx
Natural Disasters
Dependency on:-
Reconstruction Aid
External Funding
Industrial Pollution Prevention and Control Targets
Cleaner production applied to reduce raw material, water and energy consumption by 10-25 %
80-100 % industrial hazardous waste collected and treated
Pollution load from industry reduced by 10 % from current level
80-100 % factories relocated to industrial parks |


